
Bullish candlestick patterns
Using bullish candlesticks for trading
- Two candlesticks may help you purchase stocks and other financial instruments at the right moment and with the right strategy.
- Want to improve your technical analysis skills by learning more about bullish candlesticks?
- Trading with these patterns may be successful, and this article will teach you the fundamentals of doing so and point you in the direction of further resources that can help you do so.
Getting started with Bullish Candlesticks
- Candlestick charts that show a bullish candle are the cornerstone of technical analysis. However, before continuing, please review one of our previous articles if you still need clarification about a bullish candlestick.
- To restate, a bullish candlestick appears when buyers (or “bulls”) attempt to drive up prices. Because of this, the price at the end of the candle is greater than the price at the beginning. On a price graph, they are almost always shown in green or white. You may find bullish candle patterns on every chart. The ability to interpret them is, therefore, crucial.
- The financial market is a battlefield where buyers (bulls) and sellers (bears) fight to influence the price of an item. Knowing who is in the driver’s seat at the moment, you are trading might help you understand the market dynamics and make more informed trading choices. Knowing the difference between a bullish and bearish stock price is crucial to protecting your money.
- Bullish candlesticks alert you to the presence of buyers in the market—the greater the number of purchasers, the greater the value of the traded item.
Bullish Trends
- Identifying a bullish trend in a stock may be done by looking for patterns that indicate buying pressure. Bullish candlesticks are the first line of defense in technical analysis.
- Bullish candle patterns are a crucial aspect of technical analysis and are used by traders to spot reversals in trends. Trading based on these patterns is typically done as part of a foreign exchange (FX) strategy because of the importance of quickly anticipating where the market price may go.
- Technical analysis includes more than simply bullish candlesticks. They are often used with momentum indicators like the Relative Strength Index to understand a trend’s strength better.
- Traders may use a bullish candle pattern to anticipate an upward trend in the market after a downtrend. This reversal pattern indicates that the bulls have taken control of the market and may drive prices higher.
How to read bullish chart patterns
- Each bullish candlestick represents a day’s worth of data, from the starting price through the closing price to the high and low. If the initial price exceeds the closing price, the candlestick’s body will have a different hue. Each graphic representing a different period uses the same formula. Candlestick charts are used by traders in various time frames, from the minute to the month.
- Technical indicators like trend lines, momentum, oscillators, and volume may all vouch for the strength of a bullish candle pattern. Several bullish stock patterns produce a stronger reversal signal than most bullish candlestick patterns, which only represent an opportunity to purchase.

The five most popular bullish candlestick patterns
The Bullish Hammer
One of the best-known patterns is the bullish hammer. This phenomenon becomes apparent during a decline or when the trend is at its lowest. The term comes from the candle being “hammered” out of the bottom.
It’s a single candlestick pattern with a lengthy bottom shadow and a little body at the day’s high.
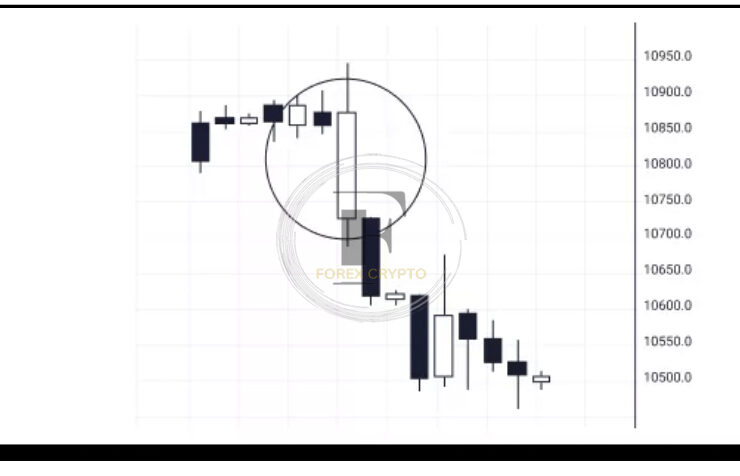
The Bullish Engulfing
- Bullish engulfing is a two-candle reversal pattern. One candle’s white body is so huge that it completely engulfs the one that came before it, which was black.
- During a downward trend, this pattern often appears. To accomplish this, the white body need not absorb the black body’s shadows; instead, it should absorb the black body whole. This is a strong indication that the bottom has been reached.

The Bullish Inverted Hammer
The Bullish Inverted Hammer resembles an inverted hammer and has a black body. Key features include a lengthy upper shadow and a compact body.
The bearish shooting star has a similar form to this motif. In contrast, the inverted hammer is a bullish reversal pattern that often appears in a downtrend.

The Bullish Morning Star
- There are three candlesticks in a bullish morning star design. Clearly, the market is turning around from a low point. Next, a black candlestick is followed by a shorter, thinner candle that gaps down to create a star.
- It is well into the black body of the first session when the third white candlestick comes to a close—a basic bottom pattern here.

The Bullish Three White Soldiers
- The Bullish The “three white soldiers” pattern indicates a strong market reversal. Three tall, regular candlesticks are climbing the chart. Each day begins with a lower beginning price than the previous day and ends with a more excellent closing price than the day before.
- The formation of a staircase indicates a trend reversal. Investors should use caution when this trend appears. Longer than standard candles might entice short sellers, driving the stock price further down.

Bullish Patterns and trader sentiment
- The top five most well-known bullish candlestick patterns point to potential buying opportunities. They may alert investors to the moment when buyer demand outstrips supply on the market. An upward reversal of such magnitude might lead to sustained profits.
- However, the presence of bullish stock patterns is no assurance that the trend will change.
- Before entering a trade, investors should wait for more price action confirmation of a reversal.
- When combined with fundamental research, which is often the foundation for trading choices, bullish candlestick patterns may provide a more nuanced perspective on the market. Check out our seminars to learn more about utilizing bullish candlesticks in your trading.
FREQUENTLY ASKED QUESTIONS
The bullish engulfing pattern is defined as follows:
The second candle totally “engulfs” the first candle’s body, indicating a reversal. Therefore, no importance should be placed on the duration of the tail shadows.
In what contexts do bullish candle patterns emerge?
During a downturn, a bullish reversal pattern should emerge. In any other context, they would be a repeating pattern.
Must bearish price action confirm bearish continuation patterns before being considered bearish?
Yes. Long, hollow candlesticks or a gap up on heavy volume are necessary for bullish patterns. Within three days after the pattern, this confirmation should usually be visible.
To what extent may bullish candlesticks be used in trading?
When the price breaks above the high of the bullish candlestick, traders often enter a long position.


Comments (No)