

A: Forex Trading Strategy.
Default MACD settings, EMA50, CCI Period 14, Levels -130/+130.
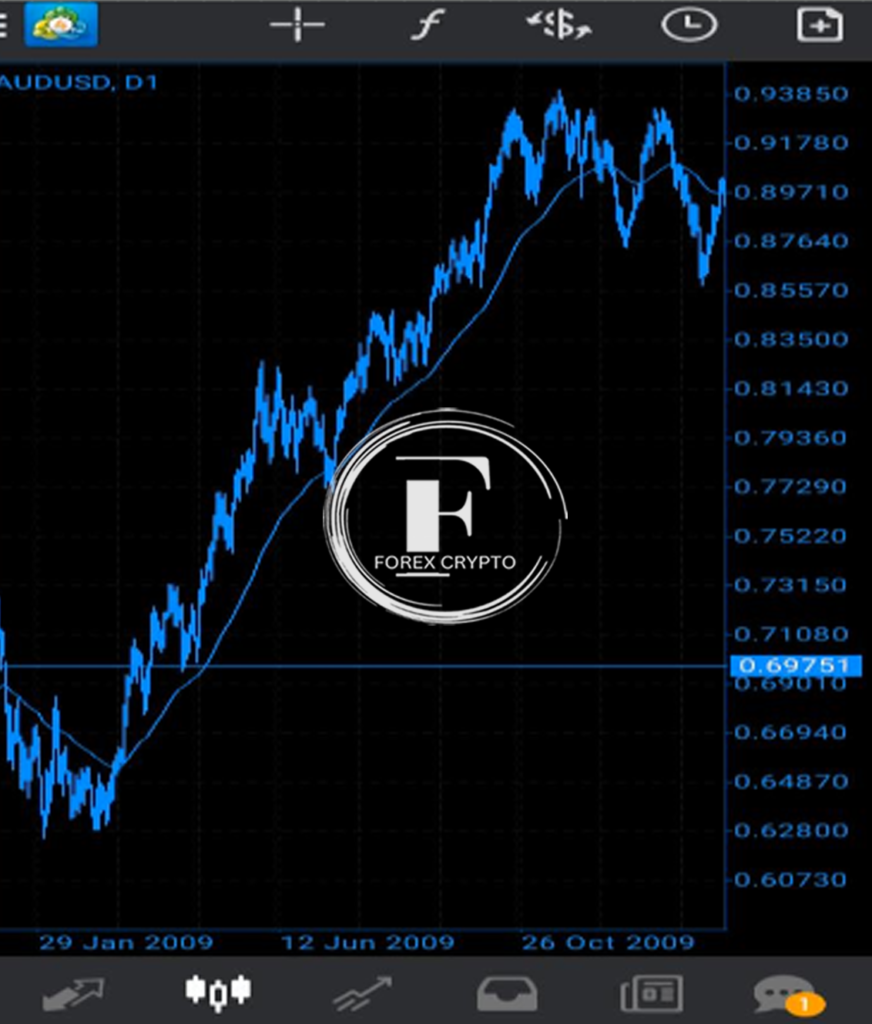
EMA 50
moving average with exponential decay.
Detects a changing pattern in the price movement and filters it.
A. UPTREND
When the majority of the candlesticks are positioned ABOVE EMA50, and EMA50 is sloping higher.
This is because we only make trades based on BUY signals.
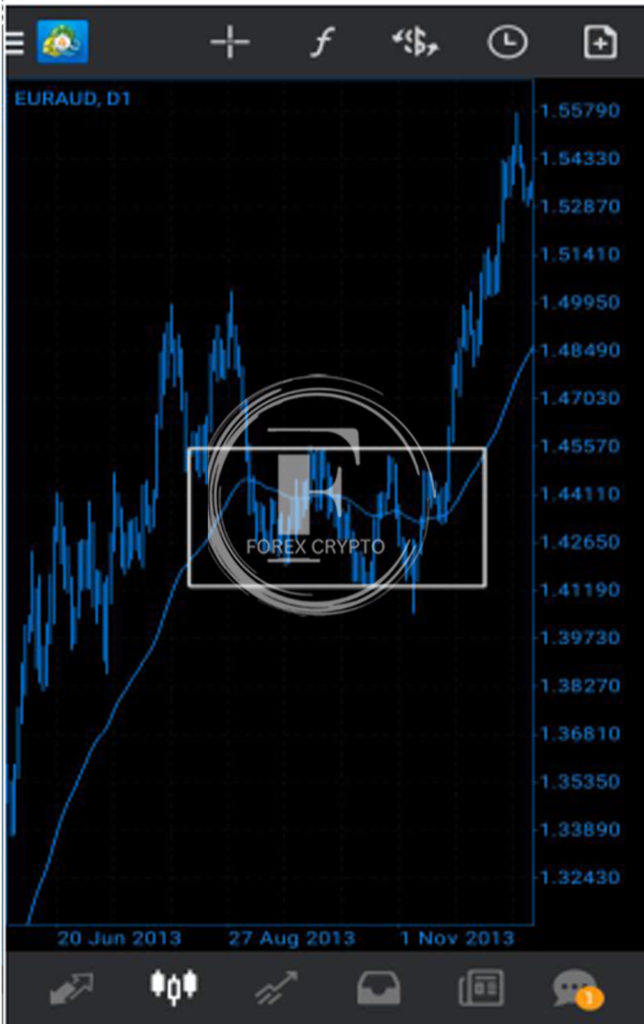
B. DOWNTREND
C. NO TREND
When the EMA50 is almost horizontal, candlesticks cross it and close above or below it.
So even after getting a signal, we don’t engage in trading.
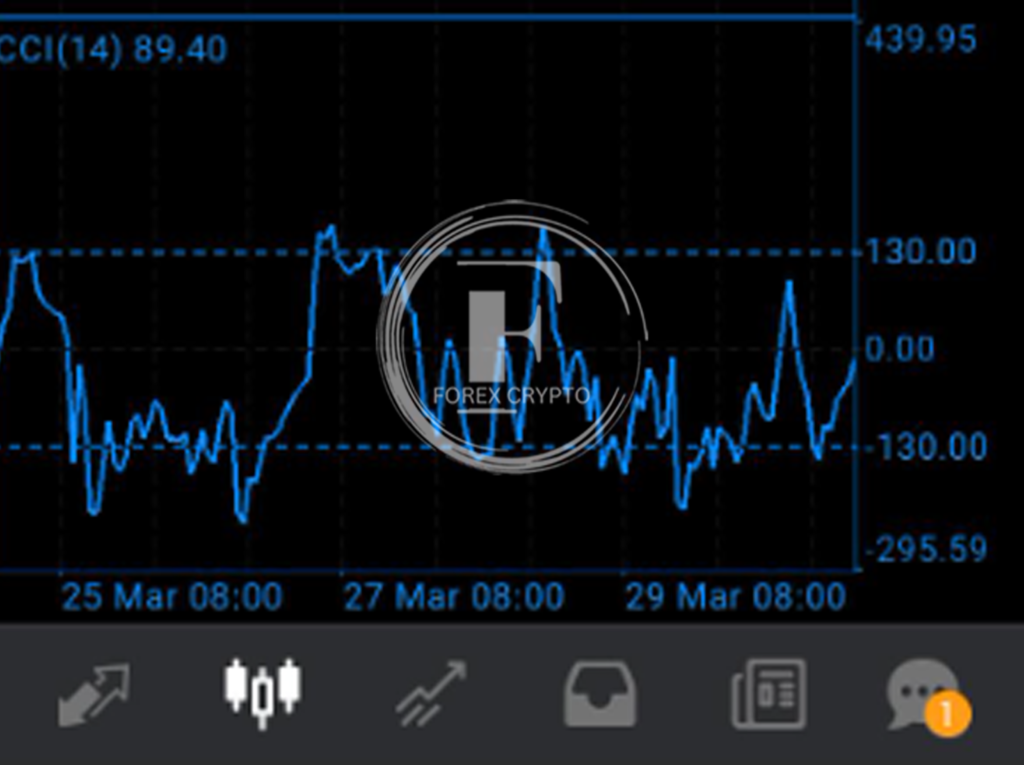
CCI (COMMODITY CHANNEL INDEX)
Location: Level -130/+130, Period 14
When the CCI is trending upward and passes the -130 level, this is a good buy signal.
Only when the CCI is trending downward and reaches the +130 level do SELL signals become active.
MACD
Histograms (BARS) and a line are used in MACD.
Specifically, “the line” is referred to as the “signal line,” whereas “the histograms” are referred to as the “mainline.”
The histogram baseline is the “0.0000 level.”
When the line is outside the histograms, all signals are valid.
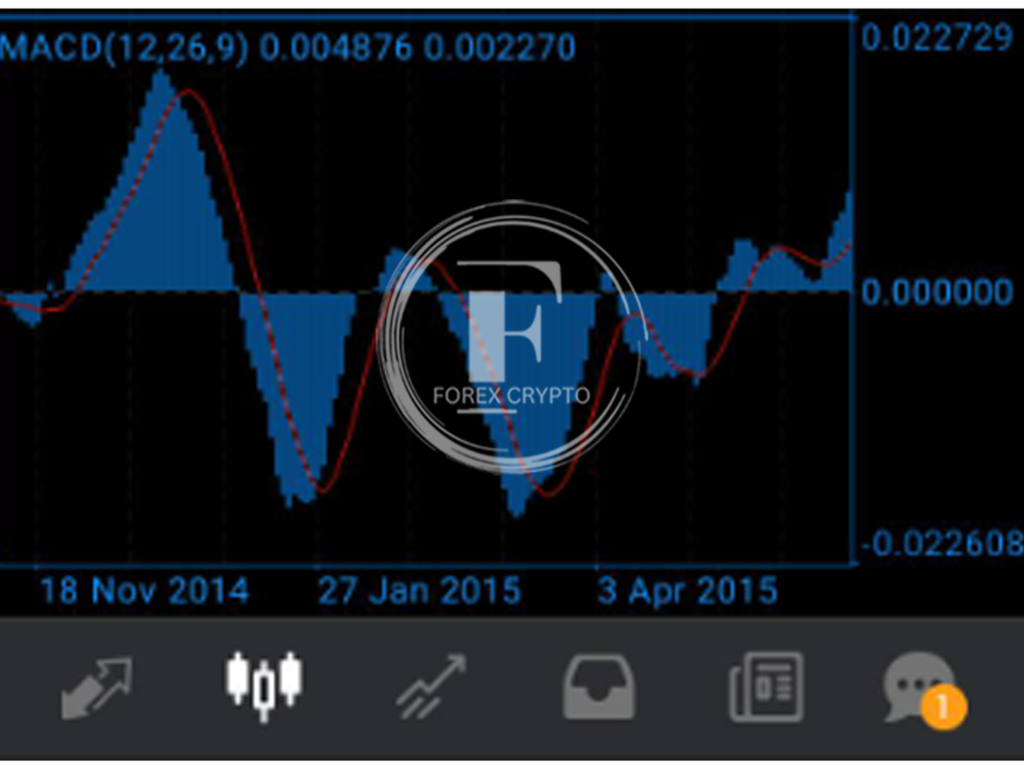
When the HISTOGRAMS are increasing (ascending) but below the baseline, and the LINE is outside of the HISTOGRAMS, this indicates a valid SELL signal. Likewise, a valid BUY signal would occur when the HISTOGRAMS decrease (descending) but above the baseline.
EXAMPLE OF A VALID BUY SIGNAL
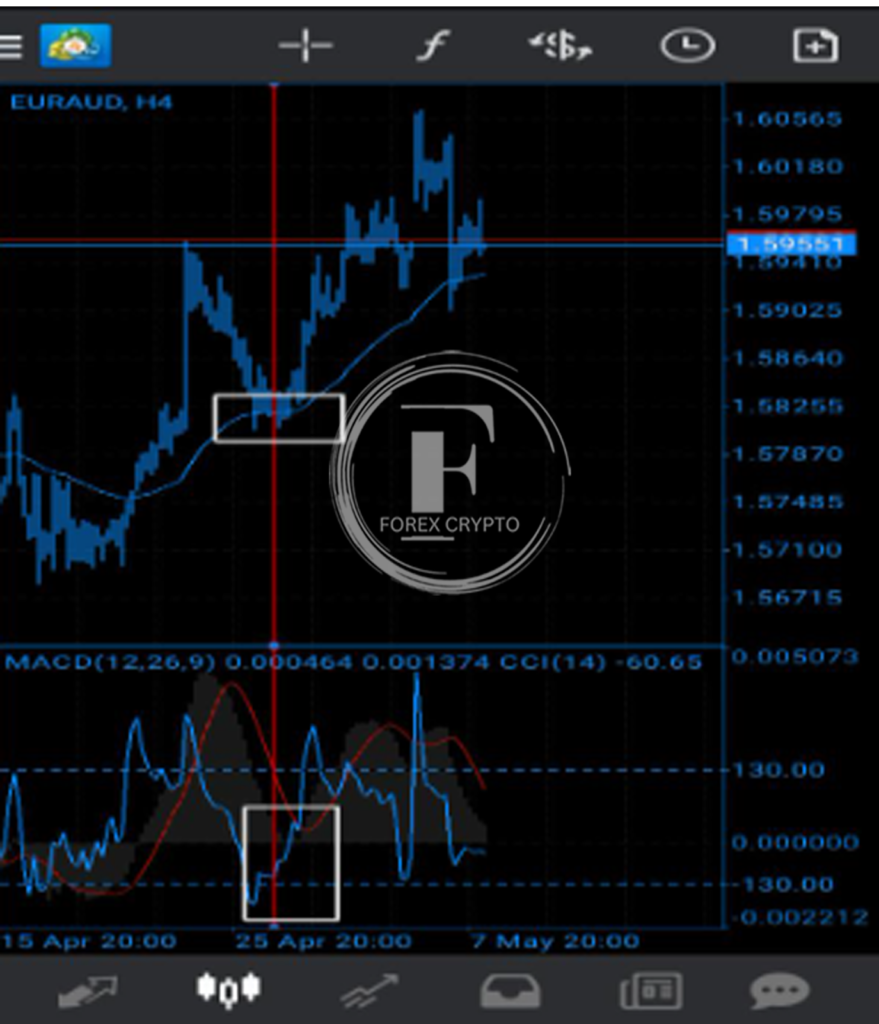
- EMA50 IS BEING TOUCHED FROM ABOVE A. PRICE IS AT THIS TIME B. The EMA50 is slanted upward, while the CCI is “coming up” from the -130 level. The MACD histograms are sloping upward from their baseline. When looking at MACD histograms, the signal line is not in the data.
Example of a Valid Sell Signal
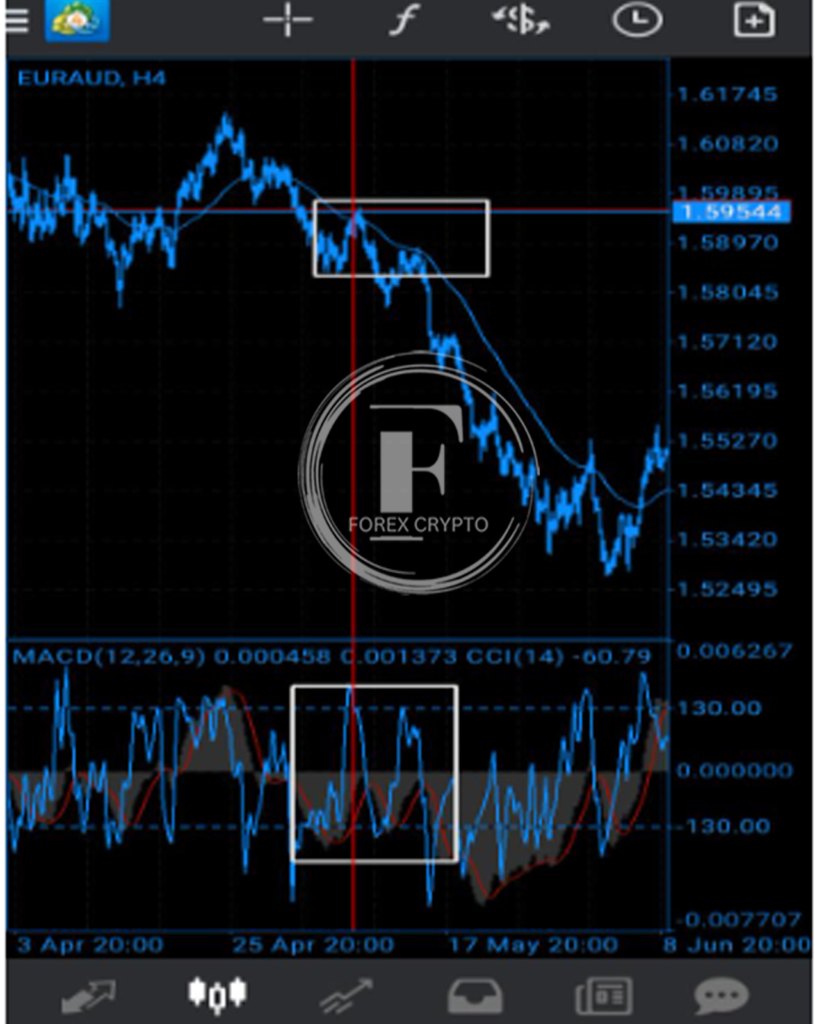
- The price is either (a) below the EMA50 or (b) the EMA50 is sloping down.
- Currently, the CCI is “coming down” from the +130 level. The MACD histogram is rising above zero, indicating a downtrend. When looking at MACD histograms, the signal line is not in the data.


Comments (No)