
One of the most significant reversal and continuation chart patterns is the opening range breakout, which is timed to catch a trend change during the first hour of trading.
The opening hour of the trading day is the busiest and fastest moving of the whole day. This is the most lucrative trading window, but it also presents the most risk if you still need a strategy in place. The opening hour of the trading day is notoriously unpredictable.
The concept of an opening range, as well as a trading strategy for said range, will be discussed in this blog post.
Index of Topics
- Breakouts from the opening range definition.
- Breakout Size, Relative to the Initial Range
- Calculator for Estimating the Probability of a Breakout in the Opening Range
- A Trading Approach Using the ORB
Breakouts from the opening range definition.
For a time frame immediately after the market opening, prices fluctuate between extremes. The first thirty or sixty minutes of trade constitute this time frame. To succeed financially in the stock market, this chart pattern is crucial.
We must now determine the day’s highs and lows. It is also important to track the market’s highs and lows before it opens since these points attract price activity like magnets.
Large numbers of transactions and high levels of volatility are typical during the market’s opening hour. As a result, many trades may be made at this moment in the trading session. As a result, trading positions are established, and the day’s price movement is anticipated based on the opening range.
Breakout Size, Relative to the Opening Range
A trader’s initial step before entering the market should be to gauge the opening range. At the opening of the market, you should observe two candles to get a sense of the trading range.
The first candle is the closing candle from the previous day’s trading session, and the second is the first candle formed when the market starts.
The range is calculated by comparing the high or low of the previous candle with the high or low of the first candle of the current trading day. The magnitude of the opening range is represented by the difference between these two prices. Take a look at the following chart to see how the size of a range is represented:
The chart’s green lines provide a visual representation of the range’s size. The high of the opening range is represented by the top line and the low by the lower horizontal line.
The Opening Range Breakout Calculator
The breakout from the opening range is the most crucial aspect of the trading session.
Breakouts from the starting range are essential for the subsequent price movement. There is a strong likelihood that the price will continue moving in the same direction when it breaks out of the range. That’s why the range breakout is used as an entry point in opening range trading techniques.
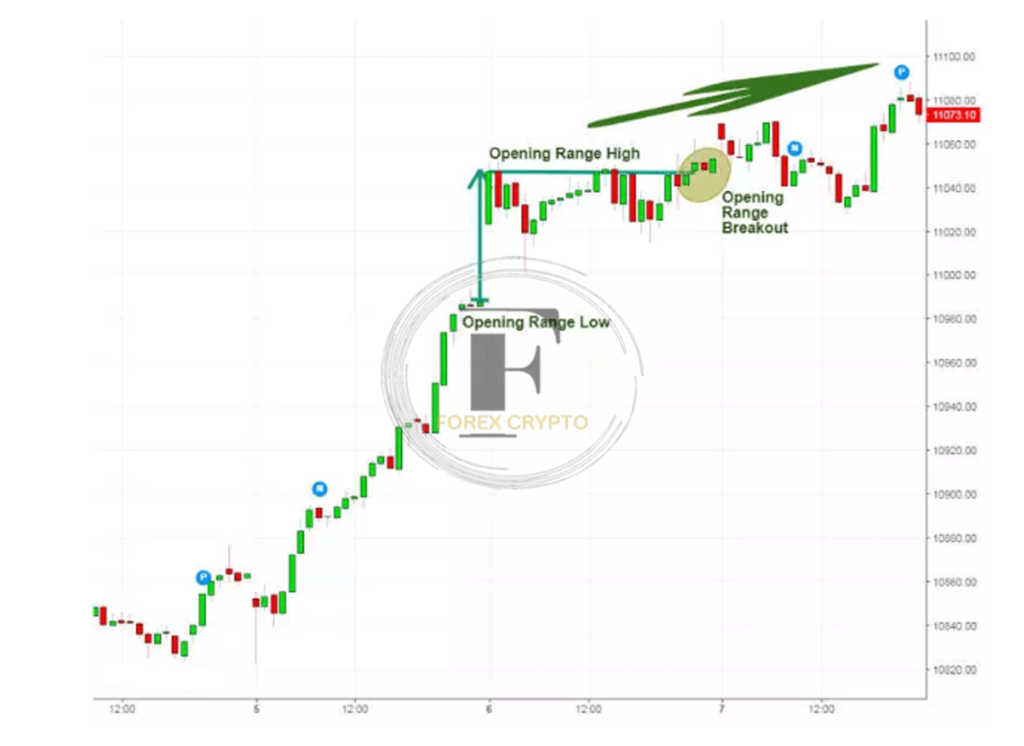
Breakouts from the first-hour range. Green horizontal lines on the graph indicate the extent of the range. For example, the breakout from the opening range occurs in the green circle, and the price immediately surges.
A Trading Approach Using the ORB
There are several strategies one might use while anticipating the opening bell at the stock exchange. Let’s talk about a plan for trading throughout the day:
1. Breakout of the Morning Range
This is a common formula for a successful opening range. Breakout of the morning range pays special attention to the extent of the gap and the high/low that is broken.
We trade in the direction of the breakout after we’ve identified the gaps and their limits using this approach. The day’s breakouts should serve as a warning.
Trading the morning breakout from a range requires the usage of a stop-loss order at all times. The loss limit should be set in the middle of the discrepancy.
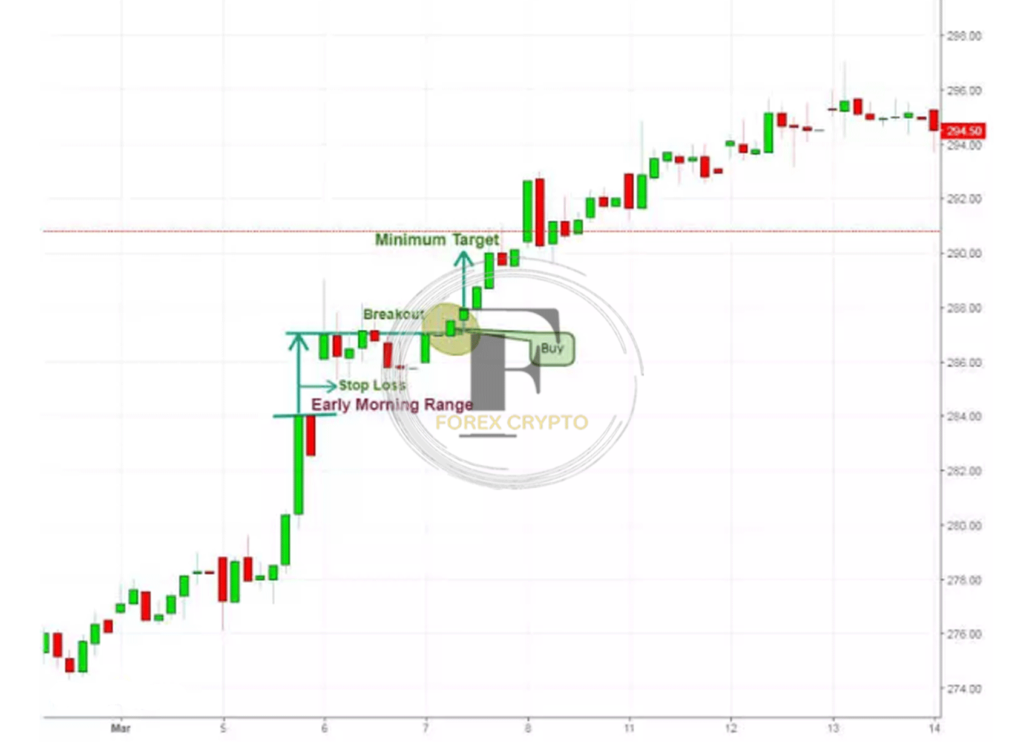
The hourly chart of ITC Ltd., as shown above, reveals that the stock broke out of its overnight range shortly after the market opened.
Two parallel lines demarcate the potential shooting area. We will initiate a trade when the price breaks out above the high of the morning range. In the center of the range is where you want to set your stop loss.
2. Pullback Gap Buy Pattern In Chart
Trading the opening range is one method; however, this one is used only for bullish trading gaps.
The price action rapidly reverses course when we see a positive gap on the chart.
This is referred to as a “pullback.” Since a negative retracement follows a positive gap makes sense.
Foreseeing when a downtrend will finish is the primary goal of this tactic.
To be successful with this tactic, you must recognize when to buy the retreat.
You can keep an eye out for reversal candlestick patterns.
It is best to wait for more confirmation of the reversal before entering a long trade.
You should always utilize a stop-loss order when trading inside the starting range.
Your stop loss should also be set below the starting range’s minimum price.
If you enter a long position because you expect the price to go up by at least the amount of the gap, you should wait until then before selling.
3. Reversal of the Gap
The gap reversal is an alternative method of analyzing the morning stock range.
When the price creates a gap but then breaks the range in the other direction, this is known as a gap reversal.
When the price drops below the beginning range’s low, a gap reversal occurs if the gap is bullish.
In a similar vein, a gap reversal occurs when the price falls below the high of the opening range.
It would help if you always backed up a gap reversal trade with a stop-loss order.
The loss limit should be set in the middle of the opening range.
Trading the gap reversal requires a patient to wait for a price movement at least as large as the gap.
Key Points
- Take the difference between the High and Low of the previous trading session’s closing candle and the High and Low of the current trading session’s beginning candle to get an idea of the range for that session.
2. Breaking out of the starting range is the most crucial aspect of trading the opening range.
- When stock prices start the trading day at the high end of their range, it’s an optimistic sign that the trend will continue.
- A negative continuation of price action is anticipated after stock prices break below the initial range to the downside.
3. the Morning Range Outbreak
- It would be best if you initiated a trade whenever price activity has moved away from the starting range.
- Trading should be initiated in the direction of the breakout, whether it’s an uptrend or a downtrend.
- An excellent place to set a stop loss is in the center of the opening range.
- Keep holding your position until the price has moved, at least the magnitude of the morning gap.
Best of luck with your studies!

Comments (No)