
- Standard methods of stock selection include fundamental analysis and technical analysis. Each offers benefits; how and when to utilize them depends on the individual.
- By researching the underlying firm and its industry and economic circumstances, the fundamental analysis seeks to find stocks with high growth potential at a reasonable price. Historically, fundamental research has been utilized by investors for longer-term transactions, with indicators like earnings per share, price-to-earnings ratio, price-to-earnings growth, and dividend yield as the backbone.
- On the other hand, the technical analysis ignores the company’s fundamentals in favor of trying to predict future price and volume changes based on statistical patterns in stock charts. The argument is that there is no use in analyzing a balance sheet since stock prices already represent all the available information about a firm. Because of its emphasis on price and volume changes, technical analysis has often been utilized for more immediate trading decisions.
- So why must there be just two options?
Which type of analysis is right for you?
- Because of this, limiting yourself to one kind of analysis might lead you to overlook crucial signs about a stock’s worth that could be revealed by the other. Due to the uncertainty around the expected transaction length, it may be prudent to use both types of analysis.
- Why not use them in a way that allows them to supplement one another’s abilities? Candidate selection should be guided by fundamentals, while entry and exit prices should be determined by technical analysis.
First, focus on the fundamentals.
Fundamentalist investors often use one of two fundamentals-based strategies:
The future of a firm is the primary concern of growth investors.
When evaluating a stock’s value, investors look at the company’s fundamentals and whether or not the current price is reasonable.
Growth investor’s strategy
Companies are structured to expand and generate profits, with the ultimate goal of distributing those funds to the stockholders who helped finance the company’s initial funding. Moreover, only some startups ever see a profit right off the bat. Nonetheless, growth investors may see a firm as promising for the future if it shows rapid revenue growth in its early days. The stock price of a new firm might rise if investors believe the company has an exciting product innovation or competitive edge. The greater the influx of new buyers, the higher the firm’s stock price. When purchasing shares in a firm, such investors often look at its revenue growth rates, both past and future.
Value investor’s strategy
Large, well-established businesses that seem priced at a discount relative to their sales or profits per share are attractive to value investors. Because of the reliability of their payouts, such investors often target market leaders far beyond their peak revenue growth years. Most often, value stocks trade at a substantial discount to book value and have a low price-to-earnings ratio (total tangible assets minus total liabilities). An example of value investing is investing in excellent businesses at reasonable prices instead of just purchasing inexpensive stocks.
Screening for growth or value
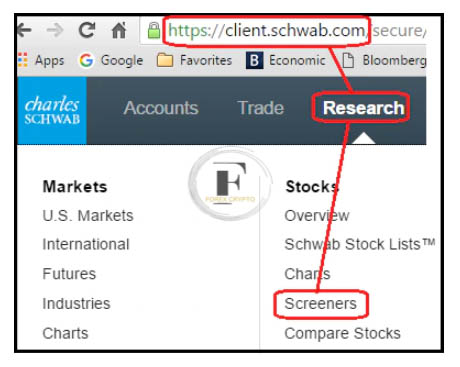
Customers of Charles Schwab may utilize the stock screening tool on Schwab.com to whittle down an extensive list of companies to a more manageable group of promising growth or value stocks.
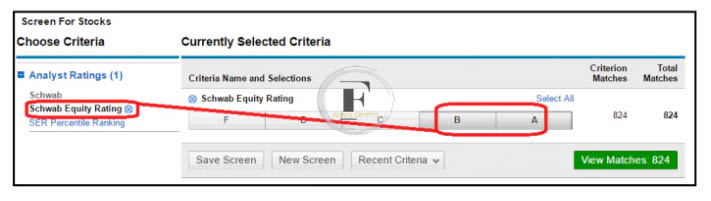
Stocks graded A or B by Schwab Equity Ratings® (SER) are considered “buy” prospects and should be prioritized for a fundamental assessment. This example shows how a straightforward action might reduce a list of 2,800 potential stocks to a more manageable 824.
Growth screening
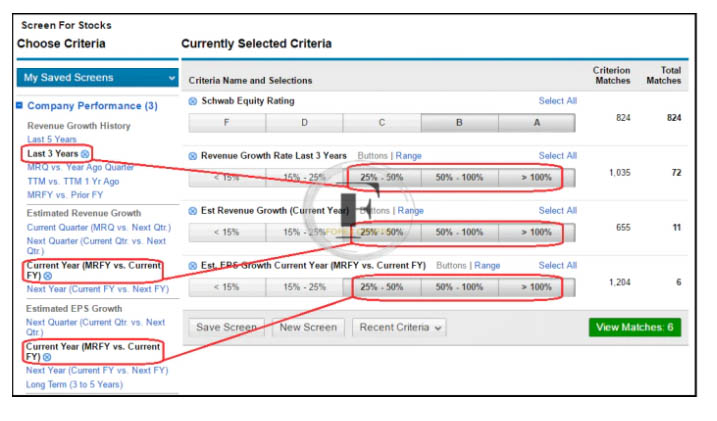
As Schwab Stock Ratings already account for many fundamental criteria, those looking for growth companies might focus on those with a history of high revenue growth that shows signs of delivering good revenue and profit growth in the future. If we apply these three filters to the sample above, we can reduce the number of potential candidates from 824 to only six.
Value Screening
There are several measures you can use to find value in companies, but a good starting point would be to look for firms that have the following:
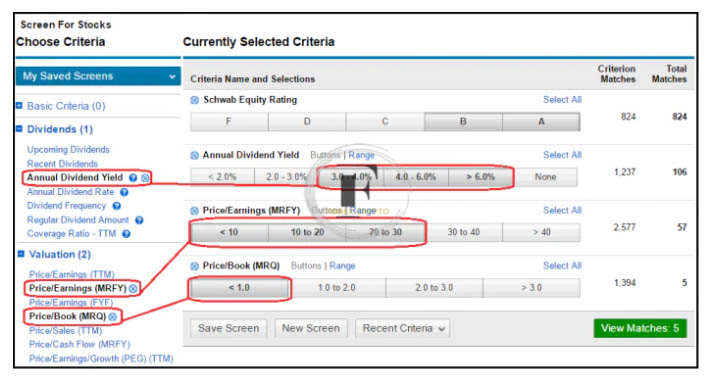
- The dividend yield is higher than usual (but not too high)
- Reduced pricing relative to profits
- A value below the company’s book value
- The list of 824 may be reduced to only five in the following example by choosing these three more criteria.
- Try to avoid investing in companies that offer ridiculously high dividend yields since they may turn out to be scams. Similarly, please refrain from assuming that since something is inexpensive that it’s low quality. A company’s stock price may be poor due to unwanted goods, incompetent management, expired patents, ongoing litigation, etc.
- After narrowing the field to a more manageable five or six candidates, applying some technical filters is time.
Technical signals
- Selecting stocks to trade based on technical analysis often entails stock screening, chart scanning, and trade execution. The purpose of stock screening is to narrow potential investments to a shortlist of 20 or 25 stocks based on technical analysis. Then, by looking for probable entries, or places where it makes sense to purchase, you can cut that list down to three or four choices in the charts. Ultimately, you’ll do a deeper chart analysis to choose which one to trade.
- Let’s pretend you’re the kind of investor that holds onto stocks for a week or more so that we can better understand this procedure.
Screen stocks using technical analysis
The following should be taken into account while arranging a screen:
- Value and market share. Because of how quickly you can get rid of merchandise, this is a great place to start. For traders who aren’t looking to invest above $100 per share, the screen may be set to filter out companies with a price over that threshold.
- Many industries and subsectors. If you want to go long or purchase a stock expecting its price to climb, look for the solid sector and industry groups; if you want to go short or sell a company you believe will fall in price and then repurchase it at a lower price if it does fall, look for the weak sector and industry groupings.
- Momentum. The goal of the technical trader is to find stocks that are moving up to purchase and equities that are heading down to short. Moving averages, which are trend-following indicators that average out short-term price fluctuations to reveal a stock’s long-term trend, may help you spot these patterns. Both support and resistance points may be found there. When purchasing pressure exceeds selling pressure, negative trends decrease, and support is reached. Conversely, when selling pressure exceeds purchasing pressure, uptrends often stall at the point of resistance.
- The closing prices are averaged over a specific time frame to get a stock’s simple moving average. Although 20 days is a standard benchmark for traders, you should choose a time frame that best suits your trading approach.
- If you are a long-term momentum trader, you should check whether or not a stock is trading above its 20-day moving average. Has its 20-day MA begun to climb beyond its 50-day MA? If you’re searching for a company to short, one strategy is to find that selling at a discount to their 20-day moving average and have a 20-day MA that is below their 50-day MA. To further refine the list, you might focus on stocks with a daily volume of at least 200,000 shares.
Scan charts
- When a list of potential applicants has been compiled, it is time to look for individuals with solid entry points. For example, pullbacks, which are temporary price movements in the opposite direction of the longer-term trend, and breakouts, in which equities see a sudden upward increase in price, are two typical entry methods.
- The first or second new high after the stock has been trading sideways for a few days might be a good entry opportunity for longs anticipating a breakthrough. A brief entry point might be the first or second new low following a period of consolidation, which could be anywhere from a few days to a week or more. For the pullback approach to work, the stock must move counter to the trend and correct for many trading days. If the longs are temporarily weak, you may want to purchase; if the shorts are temporarily strong, you may want to sell.
Trade setup
- Let’s pretend for a moment that you’re the kind of investor who likes to enter the market on a downturn and that you’ve limited your list of potential investments down to two stocks, A and B. Certain indicators, including as price patterns, volume, moving averages, and the stochastic oscillator, may be helpful when deciding between them.
- If we want to anticipate pullbacks, the first thing we must do is make sure that any fluctuation in price is just that and not a permanent reversal. For example, reversals are less likely when stocks drawback to support levels like moving averages or previous lows. Similarly, we’re interested in learning whether or not the market is bottoming out. If a stock, for instance, can break above its previous day’s high, this may signal that the uptrend is about to resume.
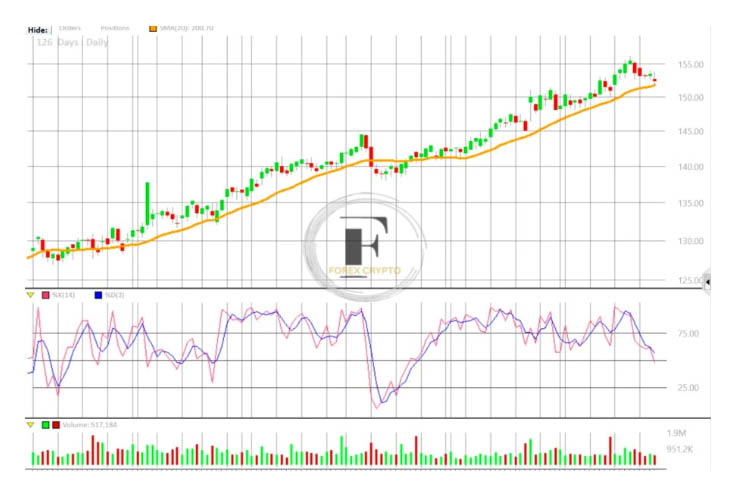
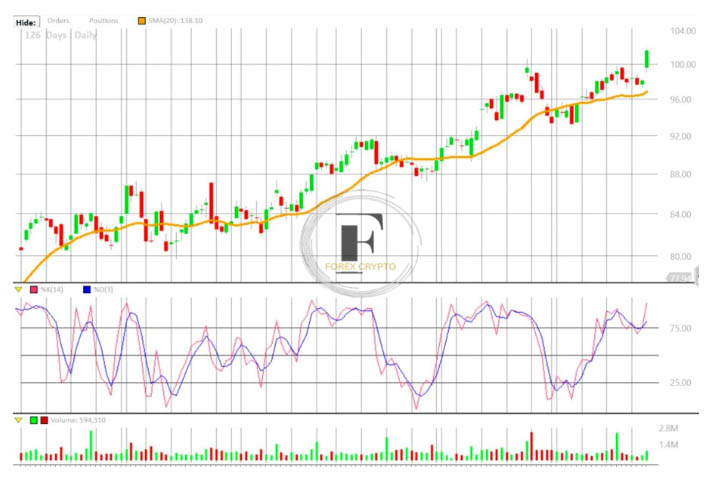
- Now, onto the graphs! A and B equities have retreated and are trading around their 20-day moving averages (the yellow lines). So, as of right now, everything is OK.
Stock A
Stock B
- The stochastic oscillator is implemented now. This is a momentum indicator that looks at the stock’s current price in relation to its highs and lows over a specific time frame. A rating over 75 suggests that the stock may be “overbought” and maybe overextended to the upside. Readings can vary from 0 to 100. Stocks below 25 are considered “oversold” and may have overextended themselves to the downside. Two lines represent the stochastic oscillator on a chart: the %K (short line, shown in red) and %D (slow line, in blue). The former represents today’s market price. The second number is the average of the first two for the last three days.
- Watch for a price reversal when an oscillator’s readings enter the overbought or oversold zones when a stock trades in a particular range. Warning: values may remain in an overbought/oversold zone for a while if a stock is significantly moving in a specific direction over some time. Comparing the %K and %D lines is helpful in either instance. The lines’ convergence or divergence may indicate a forthcoming change in direction.
- Let’s use this information in our fictitious transaction by considering the latest trading day of each stock. We can observe that throughout the trading session or at the market’s close, the share price of Stock A did not rise over its previous trading day’s high. Also, it closed close to where it began, indicating that purchasers lacked confidence.
- Looking deeper at the %D line, we see that Share A is not oversold. However, you can see that %K is still under %D; the lines diverge. Greater strength to the upward would be indicated if %K had passed %D.
- On the plus side, volume was low, which might be a warning indication if the stock suddenly begins to trade against the trend.
- Stock B’s last trading day reveals a different picture. During the trading session, the stock moved higher than its previous day’s high and ended the day higher. On a high-quality day, its closing price was towards the upper end of its range. All of these developments, together with the fact that they happened on top of the above-average volume, point to the purchasers’ takeover of the market. According to stochastics, neither %K nor %D is currently oversold, suggesting they are both substantial investments. A further positive indicator is that %K has crossed above %D. In conclusion, stock B is the superior option.
Simplify your stock selection
Picking stocks may be simple if you’re willing to adapt. Consider not trading at all and watching for active markets. It would help if you thought about both the long and short terms. Last but not least, you need to be disciplined. Avoid making a catastrophe out of the poor deals that are certain to happen. Limit your losses and continue trading.


Comments (No)