

What is a breakout?
- When the price of securities breaks through a critical technical level, such as a level of support or resistance, it may signal the beginning of a strong up or down trend. Therefore, profitable trading strategies often include anticipating and entering price movements during high volume and volatility moments.
- A change in the balance of supply and demand ultimately causes security to experience a breakout. A more significant number of investors become engaged in a security’s price movement after it breaks past a predetermined threshold, either as day traders or by placing orders in different forms.
What is breakout trading?
- The goal of breakout trading is to profit from the fluctuation in price that may occur after a breakout. The goal is to anticipate when a breakout will occur and then capitalize on the trend that develops as a consequence.
- The three components that make up a successful breakout trader are identifying the breakout, initiating the trade, and exiting at the optimal time. Finding consolidation zones where a price has been trading between support and resistance levels is the key to spotting breakouts.
TIP: How do breakout trades gain momentum?
- As expected, the strength of the resultant trend increases as time passes and the price breaks out of the close range. Trader behavior around support and resistance levels is a significant component of this phenomenon.
- Many investors may place stop orders to purchase or sell an asset just beyond its support or resistance levels in the event of a breakthrough. Therefore, these orders are activated whenever a breakthrough occurs, further fueling the breakout.
How to spot breakouts
- There are two procedures to take to identify outbreaks. First, find the price levels the market cannot break through, often known as support and resistance. The second step is to watch for a possible breakout signal.
- Breakouts in price movement from support and resistance ranges may occur in some ways, as was just described. Now, we’ll look at some of the most critical consolidation patterns.
Rectangle and channels
We get a rectangle pattern when the price movement is contained inside a box formed by horizontal support and resistance levels. The difference between a bullish and a bearish channel pattern is the angle at which the rectangle is drawn. Angled channels, like horizontal rectangles, keep their levels of support and resistance parallel.
Triangles and flags
- Ascending, descending, and symmetrical triangle patterns are all defined by a succession of highs and lows connected by converging trendlines. For example, the neutral symmetrical triangle pattern is formed by two trendlines that converge, and the breakout from such a triangle often continues in the direction of the prevailing trend.
- The upper and lower trendlines are parallel in an ascending triangle, but the lower trendline narrows as it moves upward, creating higher lows. Again, buyers have the upper hand compared to sellers, suggesting an upward breakout from this structure.
- It is the opposite of an ascending pattern, which is why we call it a descending triangle. As the price makes lower highs, the higher trendline slopes downward while the lower trendline stays flat. A break below the lower trendline is typical once a descending triangle has formed.
- Pennant patterns, sometimes known as flag patterns, are short-term formations with less extreme trend line convergences than triangles. They are characterized by an initial “flagpole” formed by a dramatic price spike or plunge in the direction of the trend. After forming a flag, prices stabilize before reversing course in the same direction as the first breakout.
Head and shoulders
- A baseline characterizes the head and shoulders pattern with three peaks, the tallest of which is in the center and the two outside peaks being relatively low. A breakout from this pattern often signals a switch from bullish to negative momentum.
Cup and handle
- When prices first rise to form a u-shaped cup, followed by a handle that slowly slopes down, a cup and handles pattern forms. Following a brief slump, this pattern indicates bullish momentum will carry prices over the cup’s rim.

- After identifying the price’s support and resistance levels, traders might hunt for a breakthrough signal. Most traders use indicators for this purpose, which may also be used to gauge the potential success of a breakout.
- Many investors study volume in addition to signs when trying to predict when a market will break out. An increase in volume may signal the beginning of a trend that will last for some time.
MACD
- Indicators like the Moving Average Convergence Divergence (MACD) help you judge the strength of price action as it approaches or breaks through key technical levels of support and resistance. On the other side, MACD may be used to determine when a trader should get out of a trade after initially buying into a breakout by detecting a decrease in the trend’s strength.
Bollinger Bands
- A 20-day simple moving average (SMA) and standard deviation lines are used to gauge whether or not price action is transitioning into a trend. A reverse breakout may occur if the price of an asset crosses its standard deviation line above or below the SMA. Bollinger Bands and the Moving Average Convergence Divergence (MACD) are a powerful combination for gauging the potential strength of Bollinger Bands-indicated reversals.
RSI
- The overbought and oversold levels on the Relative Strength Index (RSI) suggest a possible reversal in the price of an investment. The likelihood of a breakout increases as the magnitude of the price reversal increases.
- A volume RSI chart may be used as an alternative to a price RSI chart. In this case, up- and down-volume will be used in the calculation instead of price movement.
How to trade breakouts
- Once you’ve identified a possible breakout, you may begin plotting your entrance.
- There are three possible entry points on a breakout: before, during, and after the breakout itself. The potential benefits and drawbacks of each option are different.
- Entrance.
- Method.
- Drawbacks.
- Isolation Just Before the Breakout.
- Open a trade in the direction you anticipate the price to go in after it breaks out of the range while still trading inside the range.
- It’s best to avoid situations with significant volatility and slippage to receive the best price.
- More false breakouts might happen in your transaction.
- As the tide turns.
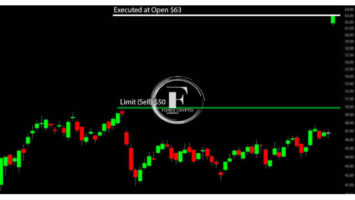
- In anticipation of a price move beyond a critical level of support or resistance, place a buy or sell order at a price just beyond the level you expect the breakout to occur.
- It will become immediately apparent to you whether or not the breakout is genuine, allowing you to decide whether or not to close your position early.
- Slippage and volatility upon entrance may be more than they would have been before the breakthrough.
- Following the breakout.
- Hold off on trading the new trend until the price returns to the broken support/resistance level.
- It protects against fake breakouts and allows you to ride the new trend after day traders cash out.
- You’ll be entering at the most secure moment possible, but your winnings will be lower than those of traders who join earlier.
How to close your breakout trade
To make money from breakout trading, planning your exit is just as important as planning your entrance. It’s essential to stop and limit losses and sensible profit targets before opening a trade.
Establishing a profit objective
Your profit goal may be set in many ways. Consider the price action of late to establish a target based on the prior range of prices that preceded the breakthrough. If the gap between the support and resistance levels were six points, then a six-point target in the direction of the breakout would be a sensible one to go for. Price swings in non-parallel ranges, such as falling triangles, may be averaged out and used as a target range.
Exiting with a loss
Using a breakout trading technique, you’ll also benefit from how quickly you can spot a fake breakout. In a typical breakout scenario, prior levels of support become new levels of resistance, and prior levels of resistance become new levels of support. A false breakout occurs when the price re-crosses a resistance or support level after breaking through it. Once you’ve joined the trade, you may safeguard your capital by placing stop-loss orders at the entry price or quit the trade promptly if the breakout attempt fails.
How to trade a breakout in forex
- For the most part, trading breakouts in forex is no different from trading them in any other market, except that you can’t gauge volume and must depend only on volatility.
- Waiting for the opening of a new trading session, such as the London or New York sector, is a simple technique to time volatility when trading forex (the two busiest in forex trading). At the beginning of the sessions, correlated majors tend to be more volatile and show more propensity to break out of the narrow trading ranges they have been confined to for the whole day.
- The European Opening Range Breakout Technique is a good illustration. First, you’d look at the Euro/Dollar (or another major in Europe) at the start of the London (or European) trading day.
- In the foreign exchange market, breakouts are a common tactic. With City Index, trading breakouts are as easy as 1-2-3.
- Sign up for City Index, or enter your login information if you already have one.
- Find the currency pairings you’re interested in trading, and focus on those with precise support and resistance levels.
- Locate areas of weakness and strength and establish safe zones.
- Trade at the start of a trend after waiting for a breakout, which may be confirmed using the indications given below.
How to identify false breakouts
It is not uncommon for the price of a security to briefly surge over a critical level of resistance or support, only to retrace its gains and return to the confines of the trading range it had been in. When traders incorrectly pinpoint support and resistance levels, the result is a false or failed breakout.
We discussed how high volume might serve as an indicator of whether or not a breakout is genuine. Look to the volume indicator to gauge the strength of a breakout and the stability of support and resistance levels. Traders should be wary of a possible false breakout if the volume doesn’t increase at essential support and resistance levels.
Stop-loss orders are crucial in breakout trading since a false breakout can only be identified after the price goes back into its previous range. Therefore, in the case of a false breakout, you may prevent further losses by placing a stop-loss order at the level of support or resistance that was breached.

Comments (No)